|
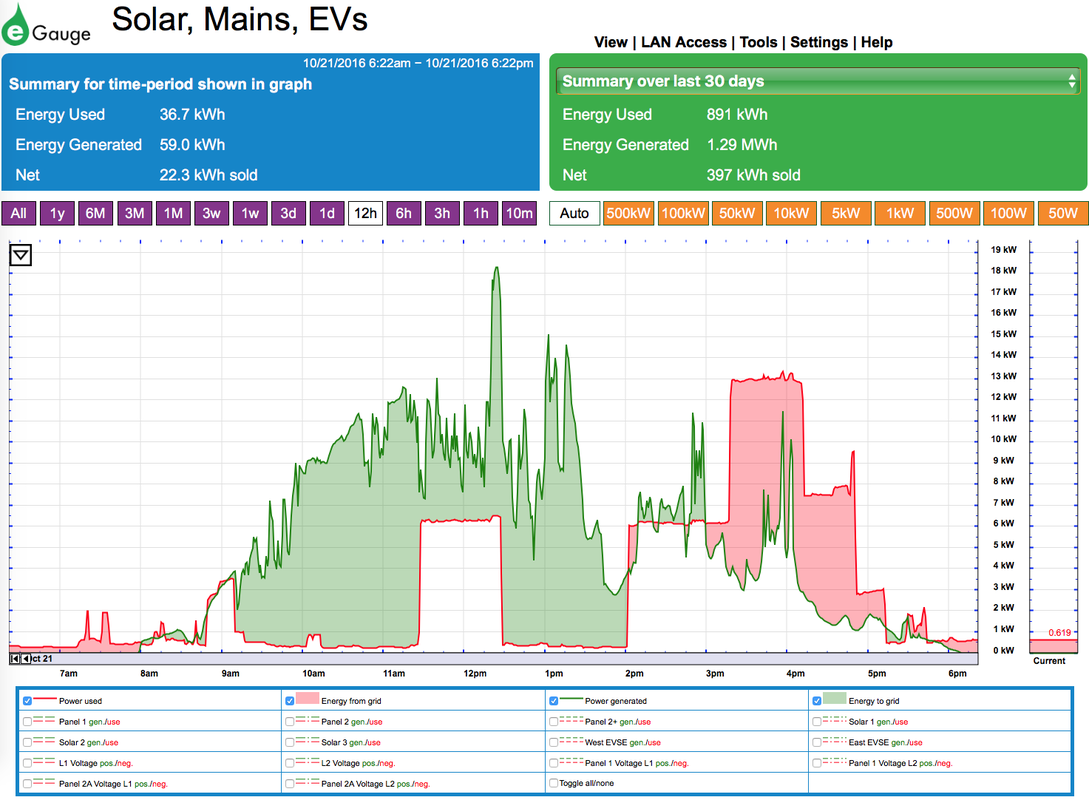
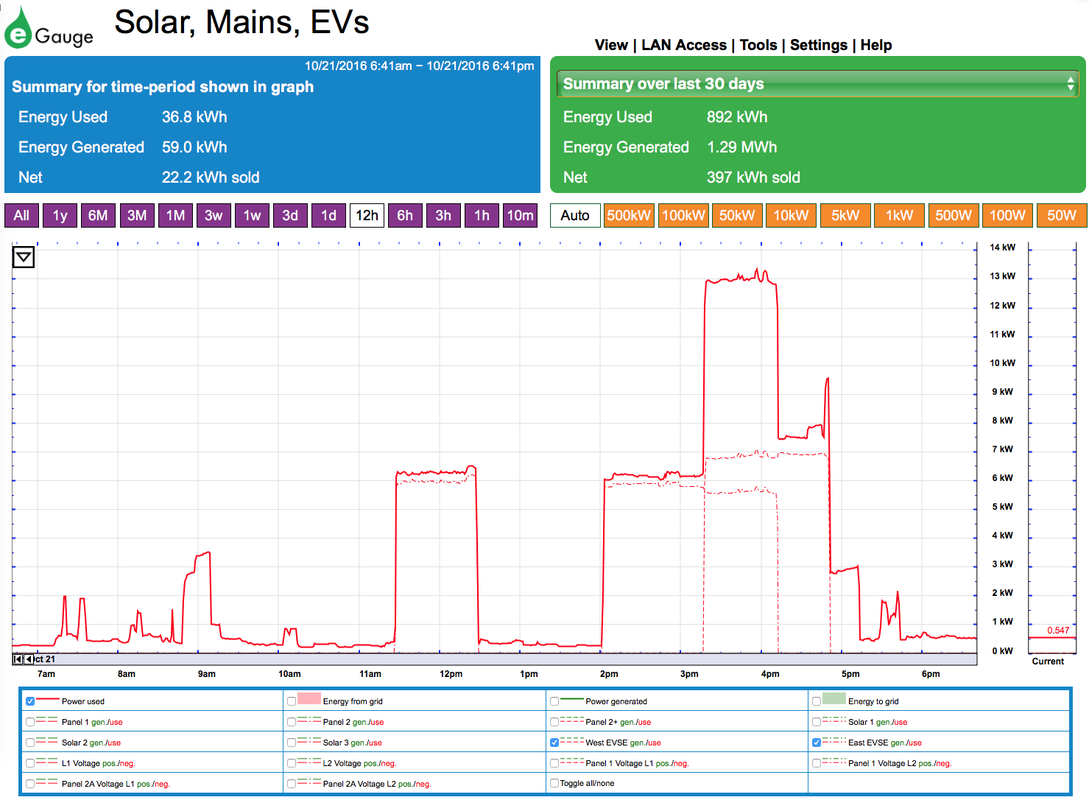
We have been in our house a bit over six weeks now. Most of the details have been wrapped up, although a couple are yet to be completed. While it is difficult to pick one thing to focus on, I have to admit, the power monitoring system has been fascinating. The system we are using is called eGauge. Many of my friends have recommended it, and I definitely see why now! We actually have three eGauge boxes running so we can monitor almost all of the major appliances, the solar inverters, total power consumption and generation, etc. The above graph is todays power generation and use. The green shaded area is energy production, via our solar panels, while the red is consumption. This was a pretty good day for solar, however one of our inverters was not working until just after noon. This is one of the details that is almost wrapped up, but not quite. The afternoon we had more and more cloud cover, so afternoon produced much less than a sunny, cloudless day would. Where they overlap, the graph shows clear, as I am consuming that much of our own power generation. The chunk of consumption around noon was when I got home and started charging my car. At 12:30 I stopped charging to run another errand, and started again about 2pm. A bit after 3pm, Kate got home and started charging her car. Normally we don't have them charging at the same time, but today was a bit unusual. Mine stopped charging at about 4pm, and Kate's at about 5pm. At every one of those times, you can see the affect on the graphs. Here is where the power of eGauge comes in. If you want a clearer view of the cars charging, you can choose exactly what to show. For example, in the above graph, I selected our two EVSEs (car chargers) and the total power consumption without the shading. Now you can see the dotted lines that represent each EVSE. You can also see how little power is used outside of the car chargers. The cars really do take about as much power as the rest of the house on an annual basis. Depending upon how it is set up, eGauge can give an incredible amount of data.
Above the graph there are purple buttons to select the time shown in the graph. Everything from 10 minutes, which pretty much gives you live results (yes, I have used this to see how much power a bank of lights uses) all the way up to a year, or since the eGauge was installed. Above this, in the blue area, it will tell you how much power has been used (or generated) by all the circuits monitored by that eGauge during the time shown in the graph. The green area shows summaries for a variety of time frames, without needing to change the graph. The above images show a few of the possibilities. In the first, I show the power used by a few of our appliance over the last hour. The bulk was our induction cooktop. The first peak is boiling water for about 6 minutes, and then cooking my pasta at a lower heat setting. Oddly enough, I am not sure why there was that trough in the middle. This calls for some more experimentation and note taking :) The second image shows our water to water domestic hot water over 24 hours. The system is pretty well insulated so it runs just a 3-4 times a day. In the mornings we use a fair amount of hot water, and in the graph you can see how the system ran once at about 5am, and then again at 9am to heat the water up again. Most other times it runs every 7-8 hours. The third shows all of the monitored devices on "panel 1". I was curious about the large spike of power used Thursday night. With eGauge, all I needed to do was hold down the "ctrl" key and hover the mouse over the peak. It told me exactly which monitored devices were using how much power. In this case, it was the wall oven. However, this also showed me that our cooktop was using 15 Watts of power even though it was off! I am not sure if it is normal for this unit to have that much power use when off, but it is something to check into. 15 Watts isn't a ton of power, but lots of devices have some "vampire drain" and they can all add up to quite a bit. 15 Watts of power over a year adds up to 131kWh which is enough to drive my car about 400 miles! If you have any questions about the system and how it works, please comment below, I would be happy to answer any questions you have. We hope to have the solar inverters working smoothly 100% of the time very soon. Unfortunately do to the issues we have been generating about 10% less power than designed. Now we are only 2% or 3% down, and soon will be at no loss. As the days and especially nights are getting cooler we are looking forward to seeing how well the house holds in heat and how the passive solar works out. So far, with a few nights down in the 30s we haven't lost more than a degree or two overnight. The true test will be when we get down under 10 degrees!
Joe Hays
11/17/2016 11:59:13 am
Mark,
Joe Hays
11/17/2016 11:59:40 am
Mark,
Mark
11/18/2016 06:37:20 pm
Hi Joe Comments are closed.
|
AuthorMark really doesn't like to talk about himself, the house is much more interesting. Archives
September 2020
Categories
All
|

