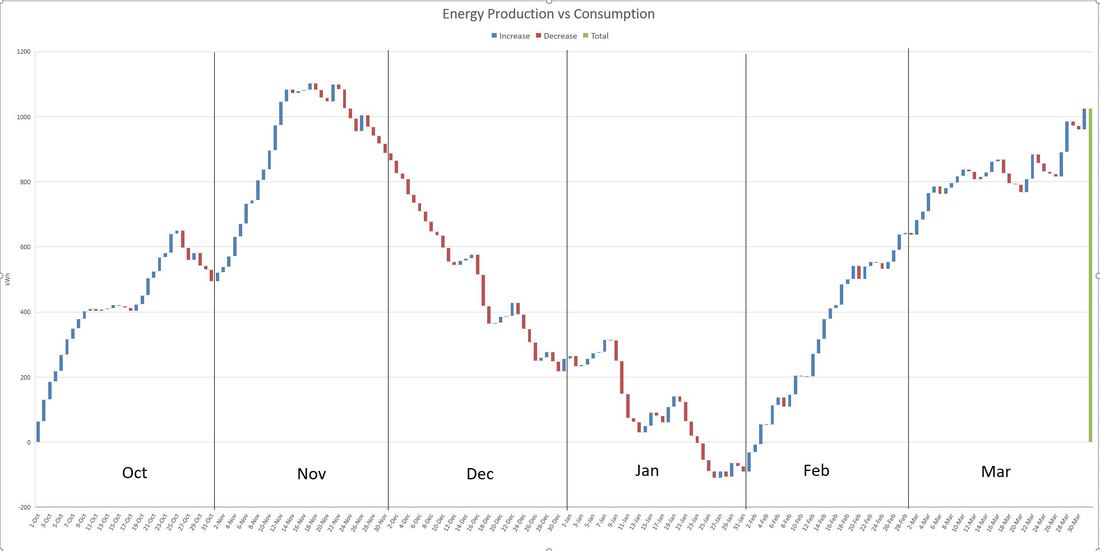
 Well, we have now lived in our house for seven months and have six months of detailed data. As of April 1st we have just over 1000kWh surplus. Our modeled energy use for these first six months is about 11,600 kWh. Our actual power use has been just over 7,700 kWh! Now that the heating season is basically over, we expect that surplus to grow even more over the spring and summer. With our first winter "in the books", we have learned a lot about how we use energy. Here are a few of the highlights...
When I created this blog, I had calculated that we would drive about 24,000 miles annually between both of our vehicles. This was 8,000 miles less than before we moved. In the last six months, we have driven a total of 7487 miles. We expect to drive more in the summer, but not all that much more. Taking that into account, if we drive another 10,000 miles in the next six months, that puts us at about 17,500 miles annually. What I didn't take into account was just how much we enjoy our house! I find myself leaving the house less often. I used to run errands or trips just because I was bored. Our new house is a much more comfortable, inviting place to be. And so, I have found I drive less. In addition to Kate's work being much closer, our errands to places such as Target, Best Buy, bookstores, etc are also much closer. In general, a third to half the distance they used to be. 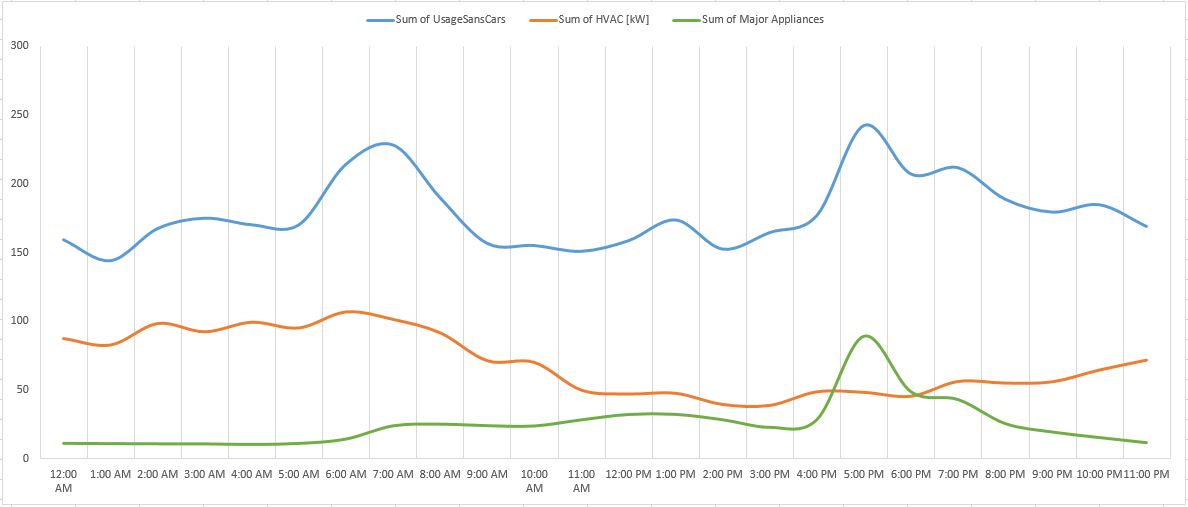 Recently I started looking at how much power we use at different times of the day.
Just above you can see a graph showing how much power we used each hour. This combines all days between October 1st and April 1st.. The blue line is our total power use except for the cars. Up until March, I was charging a car many times during peak sunshine hours to allow our solar array to work at 100%. Because of this, we had an artificial peak around 11am-2pm that doesn't represent what will be our typical use. As such, I have excluded the power for the cars from this graph. The orange line is the HVAC power. The green line is for our major appliances. The heating tends to reach a peak in the early morning, than falls off during the day when we get free passive solar heating. The stored heat lasts into the night, but needs some help from the mechanical system. More and more power is used by the mechanical heating system until the peak around 6am. Dinner time gives us a peak for appliances which makes sense. It is our main meal and the one we most often have the cooktop, oven, microwave running. We also tend to run the dishwasher after dinner. Another thing to keep in mind is that we had a relatively warm winter. In a more typical winter more energy would have been needed. Final approvals for the rest of our LEED and Greenstar certifications are due soon. Lots of paperwork involved, but we can see the light at the end of the tunnel! Happy Earth Day everyone! Now THIS is what solar power production should look like on a sunny day! I am so happy I could sing, but no one wants that, so instead I'll link to this YouTube video :) 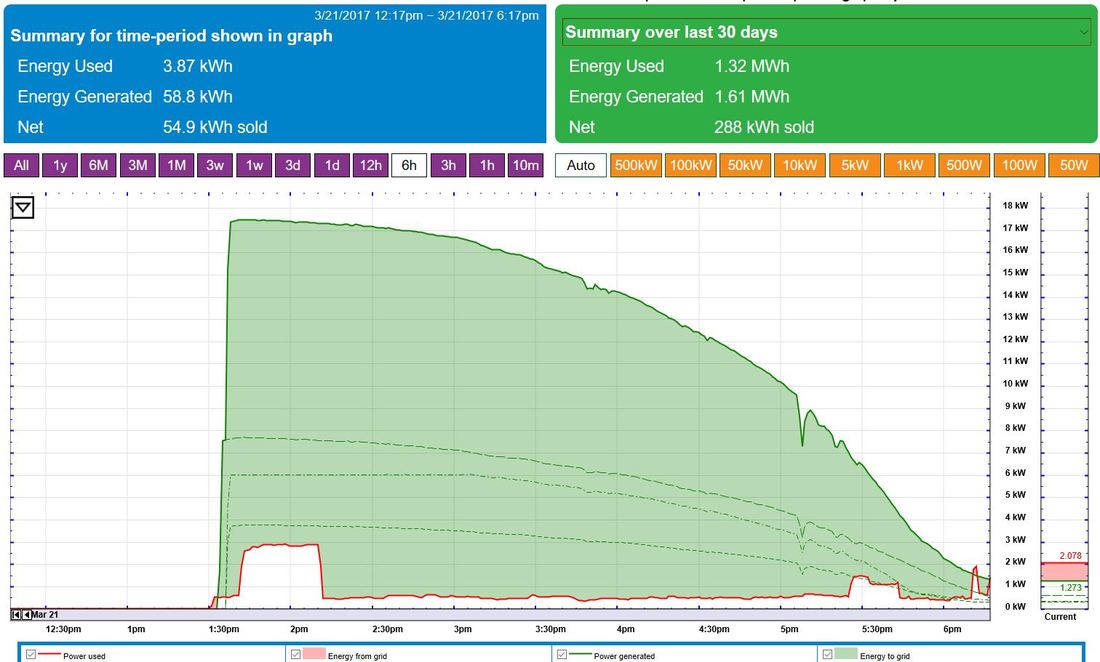 Our house power was out today while Xcel installed a new transformer. Greg from Innovative Power Systems was kind enough to get over hear within a short time after power was restored to make sure the system was all in good working order. He got here in time to test out the system on the new transformer just as we were at peak production for the day, which made for a very good stress test (thank you Greg!). The system worked beautifully! If you read some of my earlier blogs, you know we have been struggling with this for some time. Below is a sunny morning from last October which shows how the system behaved as the power climbed. Usually one of the inverters would reset itself because the Voltage got too high. Sometimes a pair would reset. The graph below shows what a system should NOT be doing on a sunny day. The dashed lines in both of these show the power generated from each of the three inverters. This is such a huge relief and I want to thank Greg and the crew at IPS for hanging in there and getting this fixed.  What I found more interesting was seeing how the voltage behaved on each day. Here you can see how steady the voltage is now, as opposed to before. Also, you can see the voltage on line 1 and line 2 are identical now, where before they varied a bit. Line 1 and 2 should each be in the 120-125 range, giving a house voltage in the 240-250 range. Normally, the house power is very close to 240 Volts. However, when our solar panels are pushing energy back out to the grid, the voltage rises just a bit. That voltage adjusts very slowly and smoothly, when working properly. Before, the voltage not only spiked much higher, but it was not at all smooth, and Line 1 and Line 2 were not identical. I am very happy we got a chance to test the system out today. The rest of the week looks pretty rainy, so I would have had to hold my breath for days, if not a week, and I am no good at that ;)
|