 We now have a year of data collection in the books! The summary of the final results are as follows:
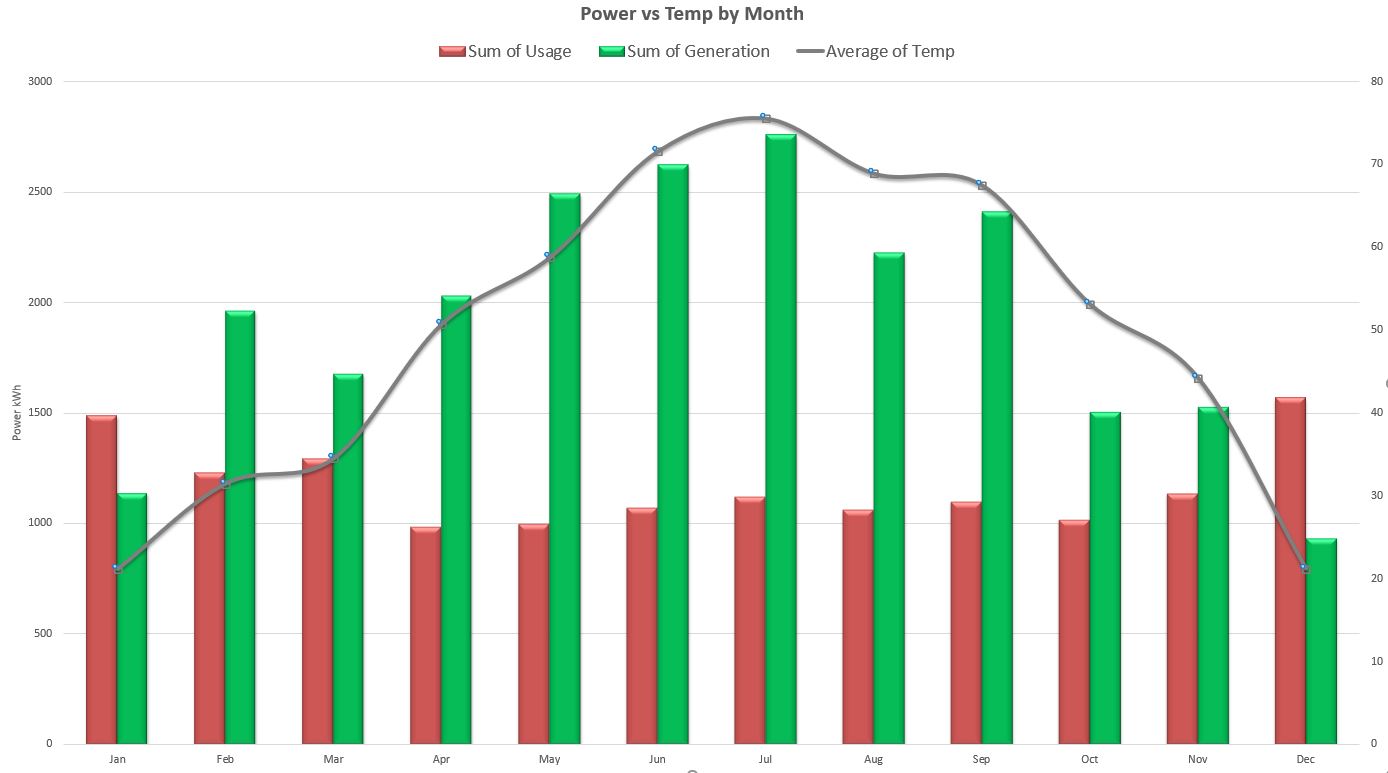
Below is a graph showing the Modelled vs Actual energy use and production. As well as a graph showing the difference between the monthly average temperature between 1980 and 2010 compared with last year's average temperatures. You can see the modelled (striped bars) energy use was much more than the actual energy use throughout the year. It was a little closer in the winter than during the summer months. I'll dig into that, but off-hand I believe part of that is that we used power to preheat the cars in the winter. I had not taken that into account in my original estimates. The modelled production (green striped bar) was less than the overall actual energy produced (solid green bar). During the first couple of quarters we were having trouble with our solar array. Once that got resolved in late March, our actual production was higher than the modelled production. Two big factors went into us using less energy than expected. First, we had a warmer winter than normal. Especially the months of November and February. Second, and the bigger factor, we drove our cars much less than expected. Before we moved, we drove a total of about 36,000 miles/year. We calculated we would drive about 8,000 fewer, or 28,000 miles/year. We actually drove only 13,266 miles! It turns out our car efficiency was less than I expected, especially over the winter. This was due to the energy used to preheat the car (it is so nice to be able to be able to warm the car up in a closed garage without worrying about a tailpipe). In addition, most of our trips were short trips which are less efficient than longer ones in the cold. So while we drove under half of the miles we had planned for, our actual energy for the cars (5800kWh) was a bit above half the energy we had estimated (10,000kWh). Still a great savings:) Many of these variables will change from year to year. For example, we could have a colder than normal winter (less and less likely). We may drive more next year. We could have more cloud cover. However, I am confident we can meet our Net Zero goal in years to come. Saturday October 7th (2017) the Minnesota Renewable Energy Society (MRES) will have a sustainable home tour. Our home, along with many others from Lacrosse to Alexandria, up towards Bemidji over to Duluth will be on tour. There are about five in the Metro area and Insight Brewery is offering a buy a pint, get a pint free to people on the tour. Details can be found by clicking here.
As always, if you have any questions or want to see any graphs of more detailed data (I have LOTS of them) just add a comment here, or on the Ohm Sweet Ohm facebook page and I will be happy to oblige. 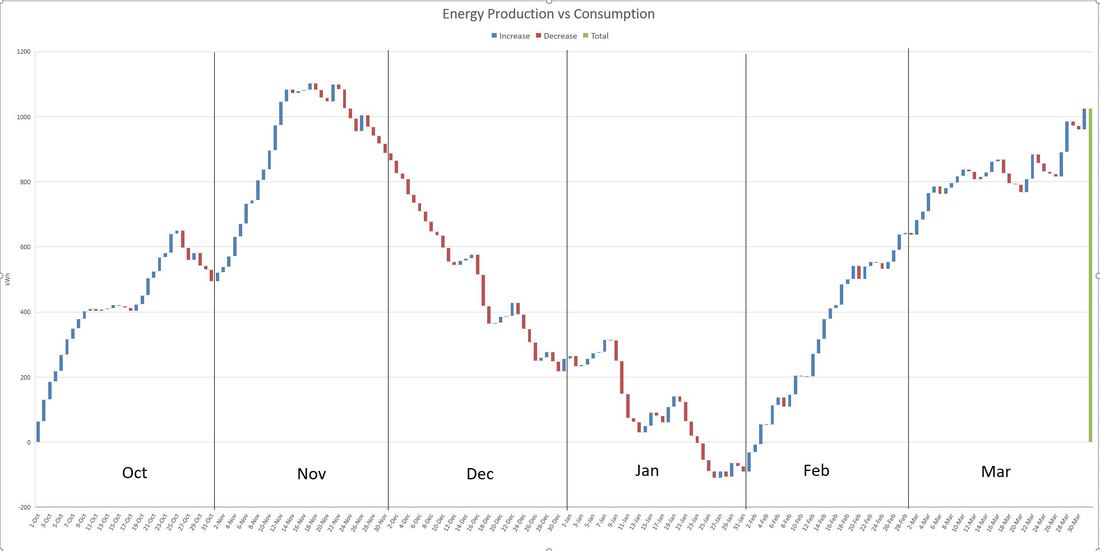 Well, we have now lived in our house for seven months and have six months of detailed data. As of April 1st we have just over 1000kWh surplus. Our modeled energy use for these first six months is about 11,600 kWh. Our actual power use has been just over 7,700 kWh! Now that the heating season is basically over, we expect that surplus to grow even more over the spring and summer. With our first winter "in the books", we have learned a lot about how we use energy. Here are a few of the highlights...
When I created this blog, I had calculated that we would drive about 24,000 miles annually between both of our vehicles. This was 8,000 miles less than before we moved. In the last six months, we have driven a total of 7487 miles. We expect to drive more in the summer, but not all that much more. Taking that into account, if we drive another 10,000 miles in the next six months, that puts us at about 17,500 miles annually. What I didn't take into account was just how much we enjoy our house! I find myself leaving the house less often. I used to run errands or trips just because I was bored. Our new house is a much more comfortable, inviting place to be. And so, I have found I drive less. In addition to Kate's work being much closer, our errands to places such as Target, Best Buy, bookstores, etc are also much closer. In general, a third to half the distance they used to be. 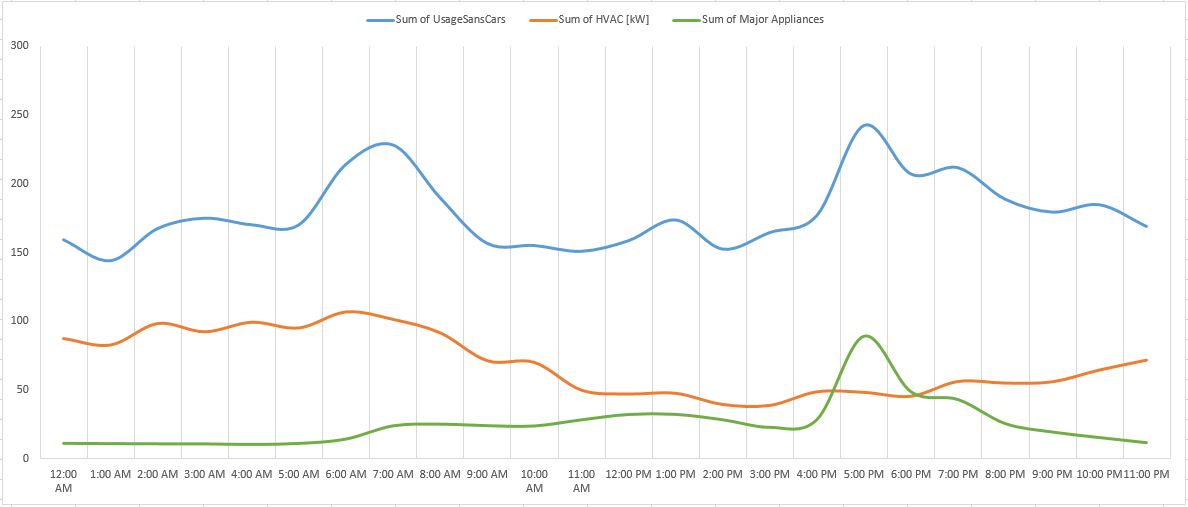 Recently I started looking at how much power we use at different times of the day.
Just above you can see a graph showing how much power we used each hour. This combines all days between October 1st and April 1st.. The blue line is our total power use except for the cars. Up until March, I was charging a car many times during peak sunshine hours to allow our solar array to work at 100%. Because of this, we had an artificial peak around 11am-2pm that doesn't represent what will be our typical use. As such, I have excluded the power for the cars from this graph. The orange line is the HVAC power. The green line is for our major appliances. The heating tends to reach a peak in the early morning, than falls off during the day when we get free passive solar heating. The stored heat lasts into the night, but needs some help from the mechanical system. More and more power is used by the mechanical heating system until the peak around 6am. Dinner time gives us a peak for appliances which makes sense. It is our main meal and the one we most often have the cooktop, oven, microwave running. We also tend to run the dishwasher after dinner. Another thing to keep in mind is that we had a relatively warm winter. In a more typical winter more energy would have been needed. Final approvals for the rest of our LEED and Greenstar certifications are due soon. Lots of paperwork involved, but we can see the light at the end of the tunnel! Happy Earth Day everyone! The first of our certifications has arrived! 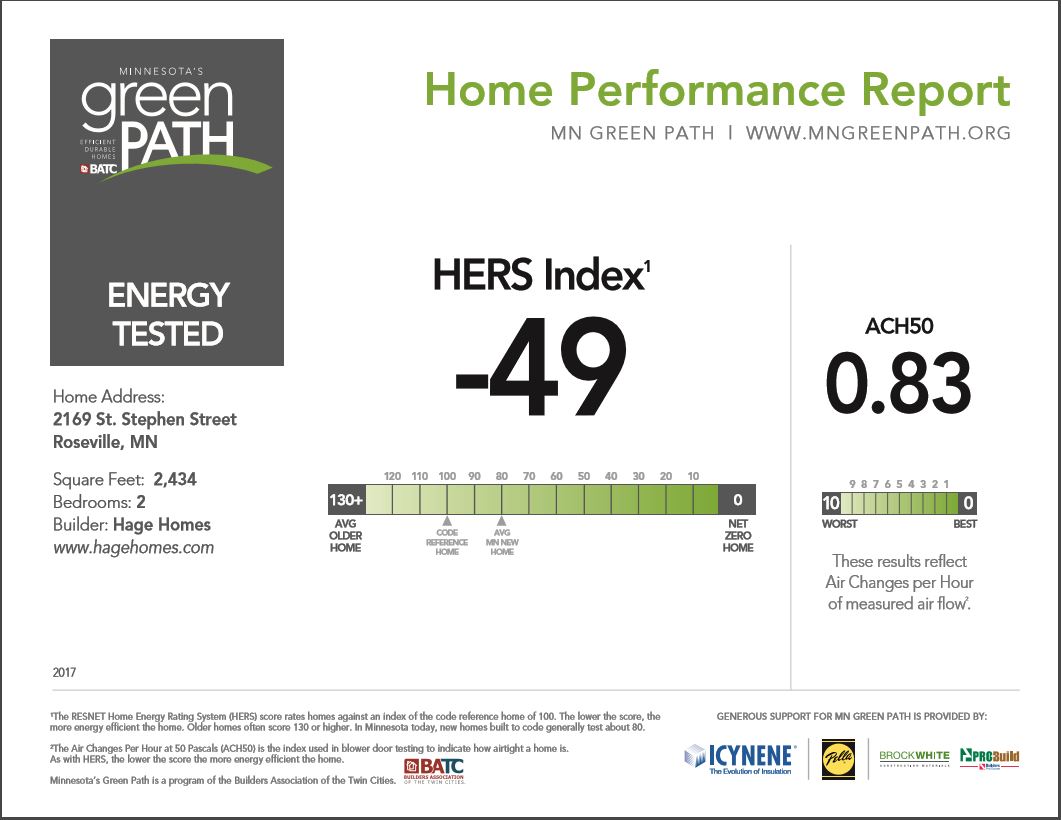 Our Energy Star Home Report is now final. This is the one with the HERS rating, which is basically a measurement for homes similar to MPG is used for cars. For a great summary of the HERS rating, check out this video: You may ask, "what in the world is the negative value rating for, didn't you go overboard?". Well, while I do often get carried away, in this case I didn't. We wanted the house to produce all the electricity annually both our house and cars use. So we sized the solar array to provide enough power for the cars, and the HERS rating takes into account all of the solar panels, but not the electric power used to charge the cars. 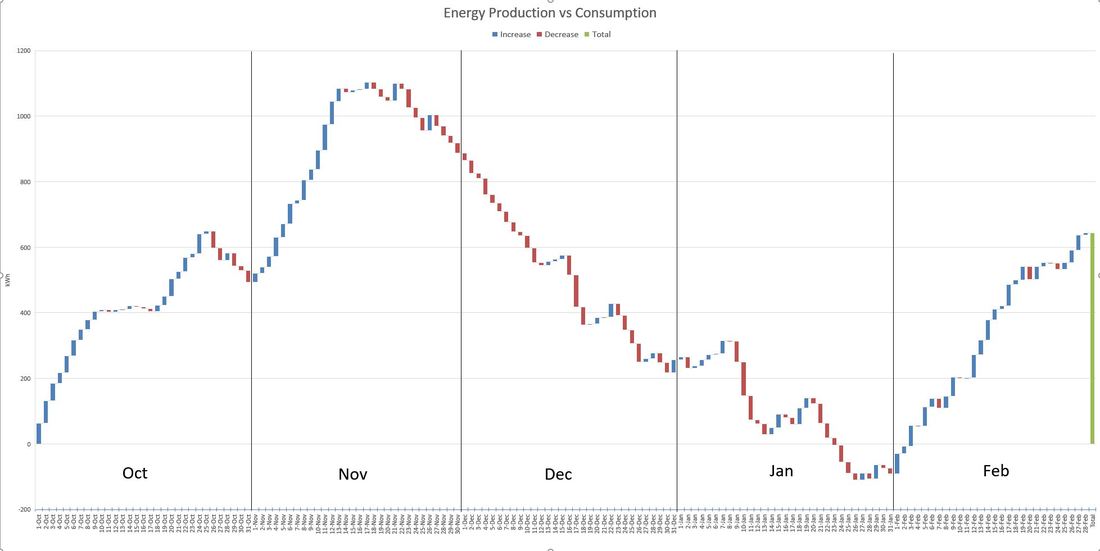 Now that February is in the history books, here is an updated graph of how we are doing so far. If I do say so myself, it is looking very, very good!
February was extraordinarily sunny and warm. As such, we had our highest production month yet (measured back through October) and the heating system took much less energy than a typical February would. More certificates should be complete soon! I'll be attending a Net Zero open House in Minneapolis tomorrow (Friday, March 3rd from 3-8pm) at 2021 Harriet Avenue, Minneapolis. Our architect, Marc Sloot, will be giving a short speech at 5pm. Stop on by, if you are in the area, and see how they renovated a very old house to the Net Zero standard, it is pretty amazing:)  After months of producing more energy than we used, last month's bill arrived and we had to pay the electric company this month...
We have three months of energy data on the books now! I must say it is much, much easier to be efficient with energy when you can measure it. Just as it is a lot easier to lose weight, or control your blood sugar (if you are diabetic) if you measure your weight or blood sugar. The tool we use for most of our measurements is called EGauge. We have it set up to measure many aspects of our house's electricity use, and I have learned a lot over the last three months watching how different components in the house use power. 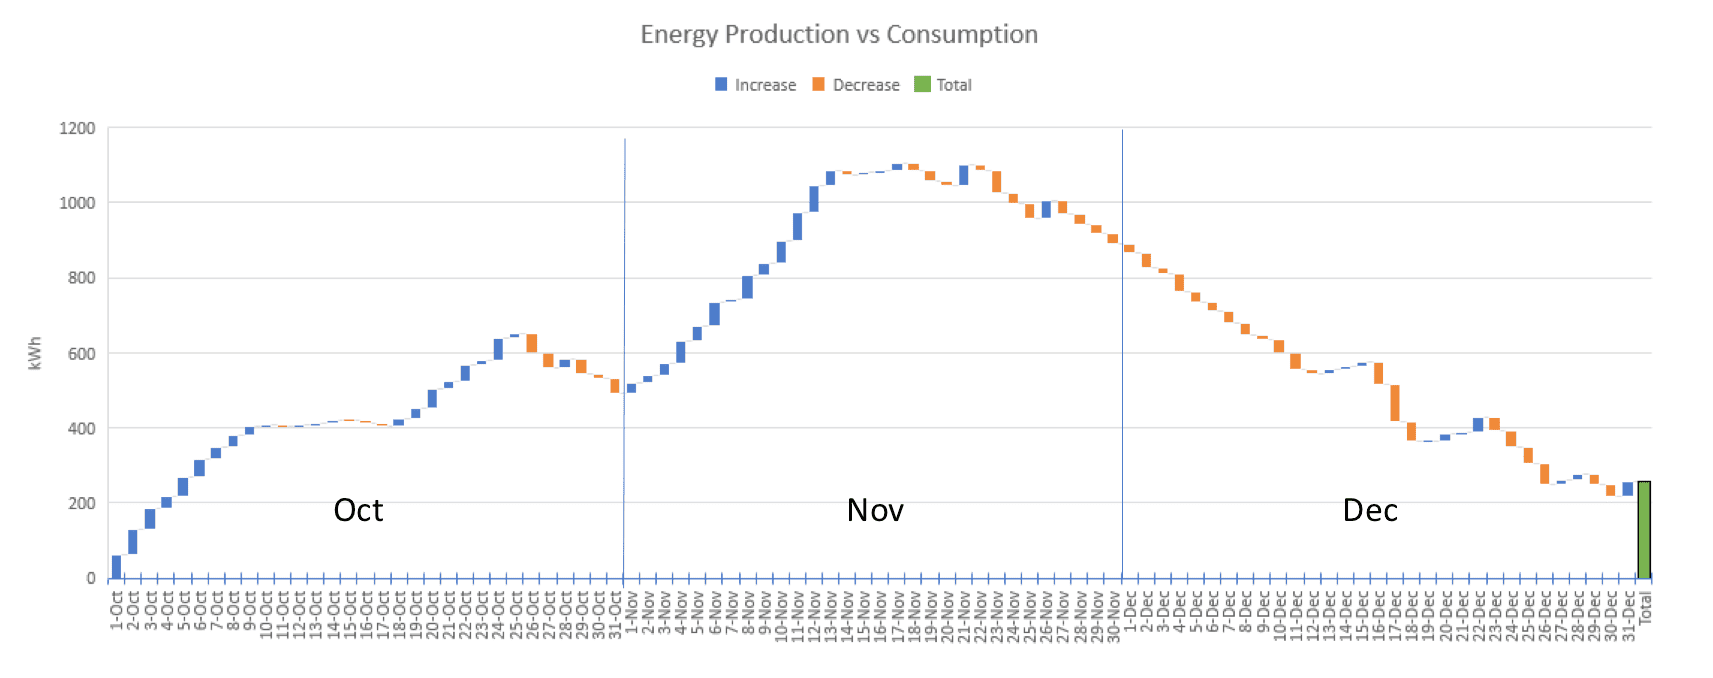 |