|
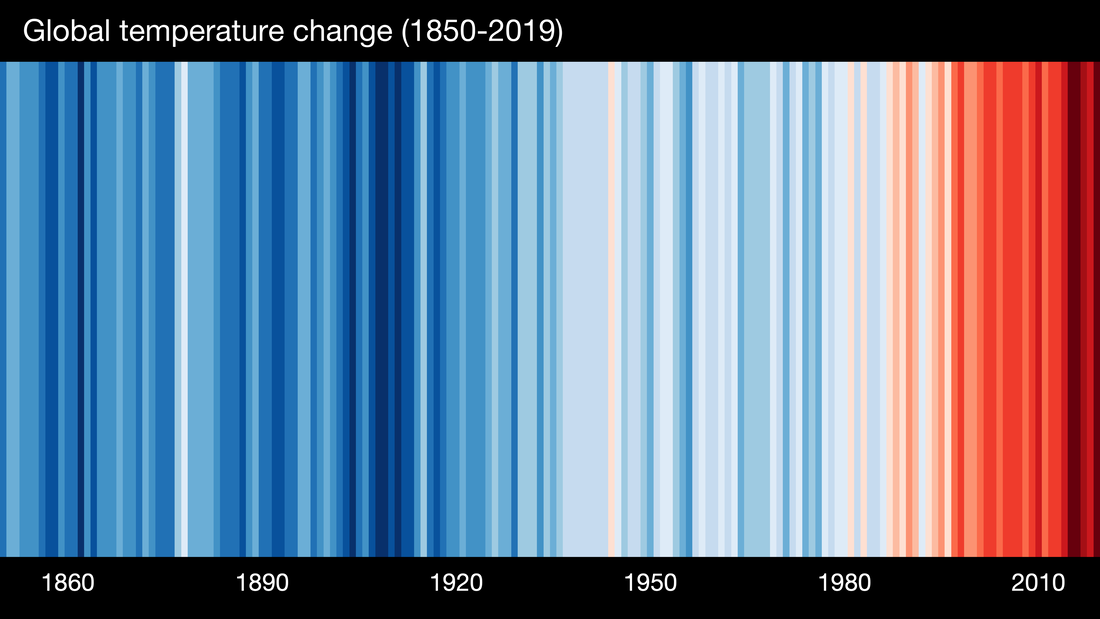
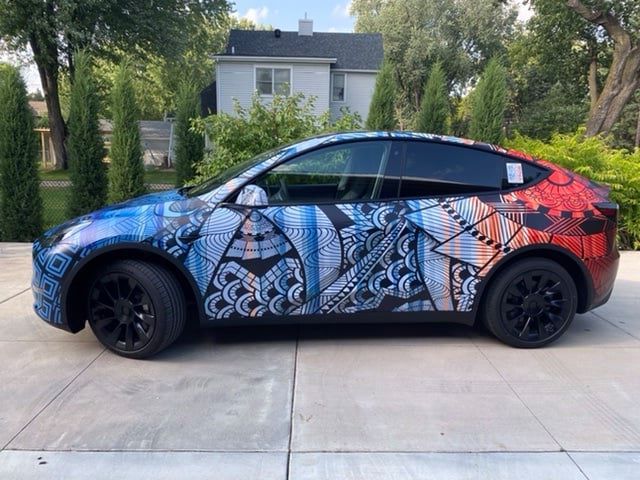
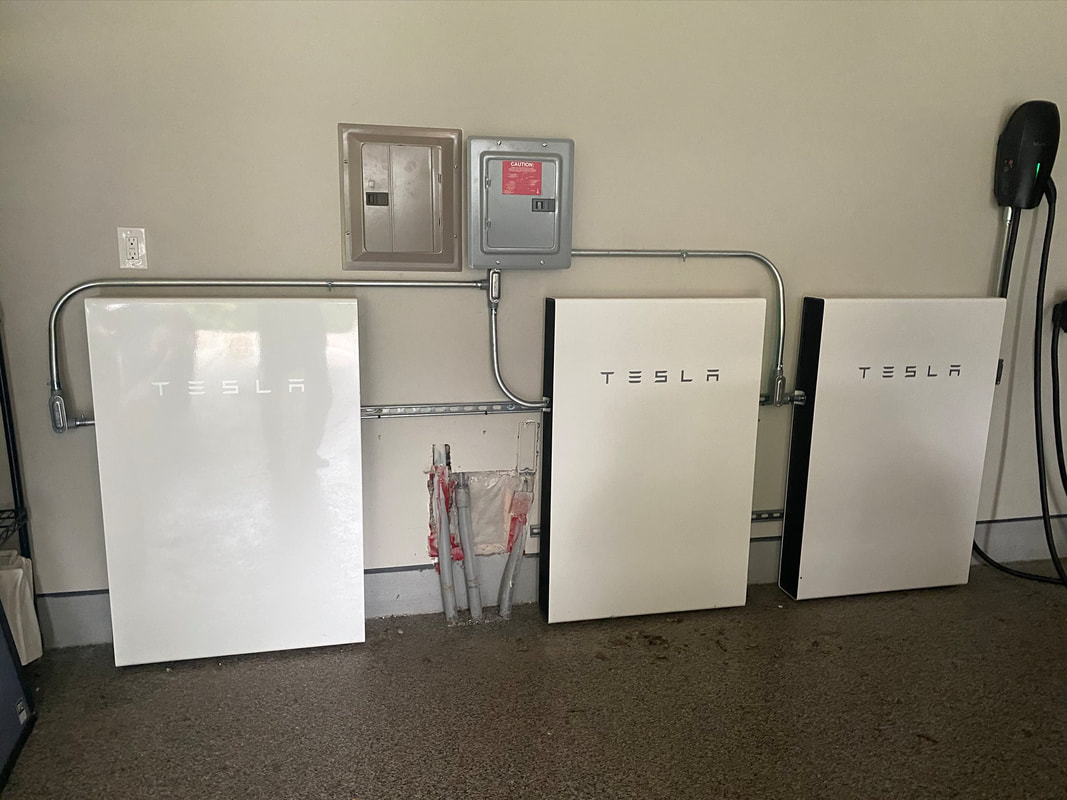
Professor Ed Hawkins at the University of Reading created a simple graphic which relays a ton of information in a very understandable way. His Warming Stripes creation inspired me to display it on my Tesla Model 3 a couple of years ago. That went very well. Lots of people were curious and asked questions, which is exactly what I was hoping would happen. Well, this summer I have a new Tesla Model Y. I wanted to do something more artistic, while also incorporating the Warming Stripes. The wizards that created and applied this wrap are the folks at Platinum Automotive Wraps, also called Tint Pros. If you are in Minnesota (or western Wisconsin) I highly recommend them! This time we stretched the design out from front to the back of the car so we could include more years. The stripes start at 1906 near the front of the car and run through 2018 near the back of the car. The decal on the side window you see (there is also one on the other side) is a QR code leading to the website: showyourstripes.info. I used the global temperatures, At the site above, you can find images showing the temperatures for a large variety of regions, countries or even individual states/provinces. For those that want to get more into the details, the showyourstripes.info site also has information about the data used and details about the method for the display. I loved the interest added by the negative space while showing the warming stripes to better effect than I had previously. On another note, our PowerWalls (which I first discussed in this blog post) have had some upgrades! Tesla consistently improves the software through updates (both their cars and PowerWalls). In the past few years our PowerWalls have recieved updates to allow a number of new options.
Over four years now, our NetZero house has been a wonderful home. It has met and often exceeded our expectations!
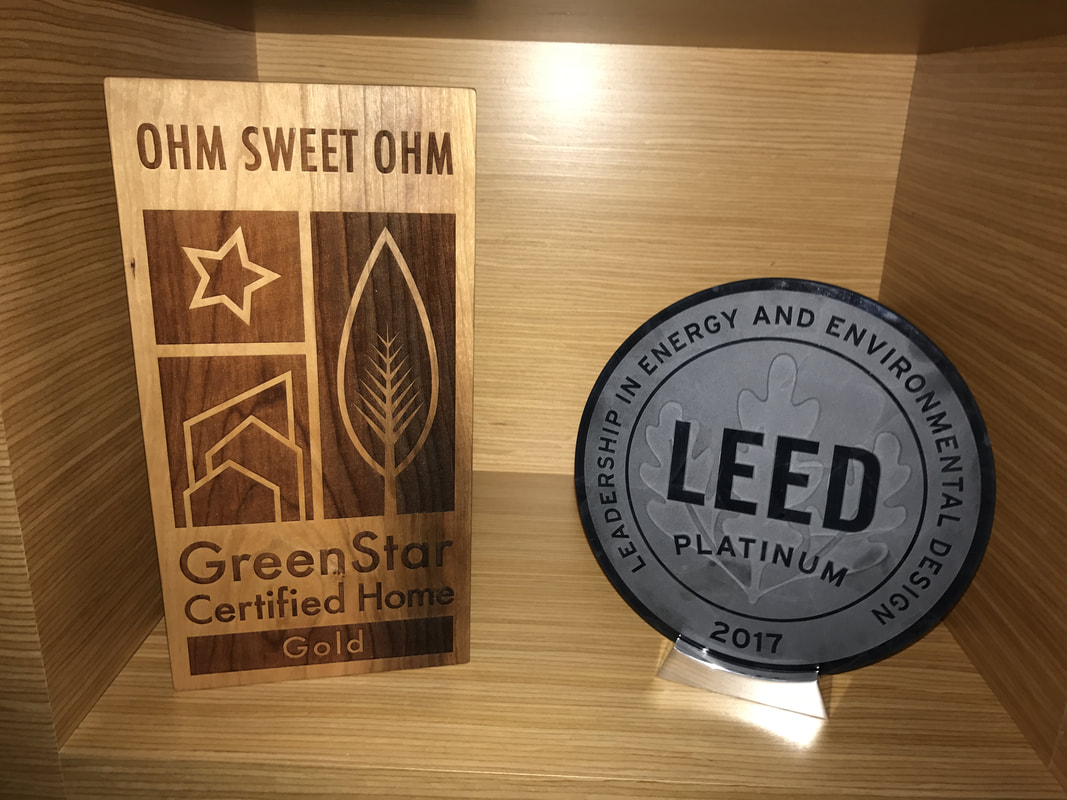
And while the additions completed what we wanted to do with the original design, we know that no house is ever really complete ;-) I look forward to how the house will continue to grow and change in the future! We have been in our Net Zero home for a year now, and have learned a lot, both through the experience of designing the house and the time living in the house. Our data tracking started on the 30th of September, 2016, so we have a month to go before we have a full year of data. I'll be posting another blog when the final numbers are in. We also have the approval of much of the local wildlife;) We have had various visitors, and I have to say, I think the rabbits are the happiest and most well fed! One of the really interesting things in our neighborhood is the number of black and albino squirrels. And they both love exploring all the nooks and crannies in our stack of boulders. We have seen deer and turkey as well. We also have completed a number of certifications, including GreenStar Gold and LEED Platinum! Our Living Building Challenge is still in process. The last piece of that particular certification is a year's worth of data tracking. That will be complete in a month. So far, we are well ahead of our goal so I am very confident we will reach that. More about what the LEED certification is can be found here. Additional information about the GreenStar certification can be found here. Our home along with details and the GreenStar and LEED checklists can be found on their site here. While we strived to reach LEED Platinum, we originally expected to reach LEED Gold. A lot of work was done by our team, and we were thrilled to get the news this summer that we had indeed reached Platinum :) Our solar array continues to work flawlessly since the final fix last spring. We also have done some preparation work to get ready for three Tesla Powerwalls! If you ready some of our early posts, you may remember we wanted to have one or more in place last winter. It looks as if we are getting those within a couple of months (we have a signed agreement with an installer). This was long awaited, but will be worth it once we have them in place. ProudGreenHome did a piece on our house and posted a video produced by Geocomfort (makers of our geothermal heat pumps). Click here to see it. Greenhome institute also made a live video earlier this summer.
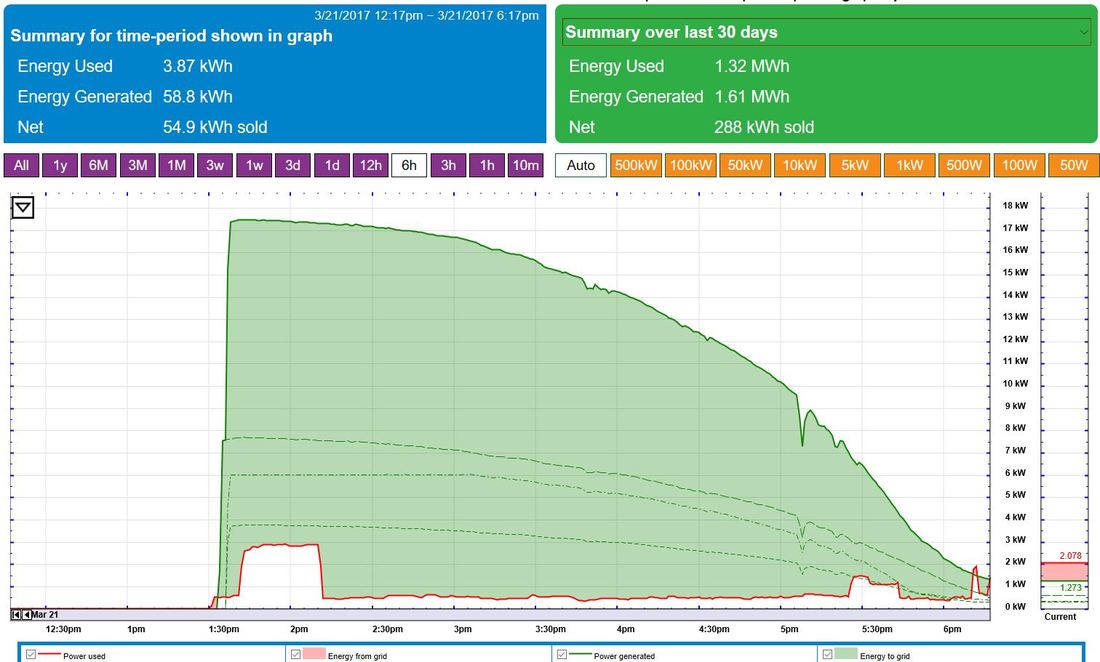
Each video includes many members of the team, including our architect, builder, HVAC wizard, interior designers, landscape designer and a representative from our solar installers. Part 1 can be seen at https://youtu.be/NjSwoB8f8Ok Part 2 is at https://youtu.be/94YlOp_SXZE Now THIS is what solar power production should look like on a sunny day! I am so happy I could sing, but no one wants that, so instead I'll link to this YouTube video :) Our house power was out today while Xcel installed a new transformer. Greg from Innovative Power Systems was kind enough to get over hear within a short time after power was restored to make sure the system was all in good working order. He got here in time to test out the system on the new transformer just as we were at peak production for the day, which made for a very good stress test (thank you Greg!). The system worked beautifully! If you read some of my earlier blogs, you know we have been struggling with this for some time. Below is a sunny morning from last October which shows how the system behaved as the power climbed. Usually one of the inverters would reset itself because the Voltage got too high. Sometimes a pair would reset. The graph below shows what a system should NOT be doing on a sunny day. The dashed lines in both of these show the power generated from each of the three inverters. This is such a huge relief and I want to thank Greg and the crew at IPS for hanging in there and getting this fixed. 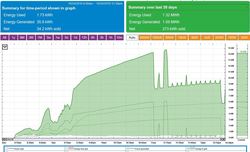 What I found more interesting was seeing how the voltage behaved on each day. Here you can see how steady the voltage is now, as opposed to before. Also, you can see the voltage on line 1 and line 2 are identical now, where before they varied a bit. Line 1 and 2 should each be in the 120-125 range, giving a house voltage in the 240-250 range. Normally, the house power is very close to 240 Volts. However, when our solar panels are pushing energy back out to the grid, the voltage rises just a bit. That voltage adjusts very slowly and smoothly, when working properly. Before, the voltage not only spiked much higher, but it was not at all smooth, and Line 1 and Line 2 were not identical. I am very happy we got a chance to test the system out today. The rest of the week looks pretty rainy, so I would have had to hold my breath for days, if not a week, and I am no good at that ;)
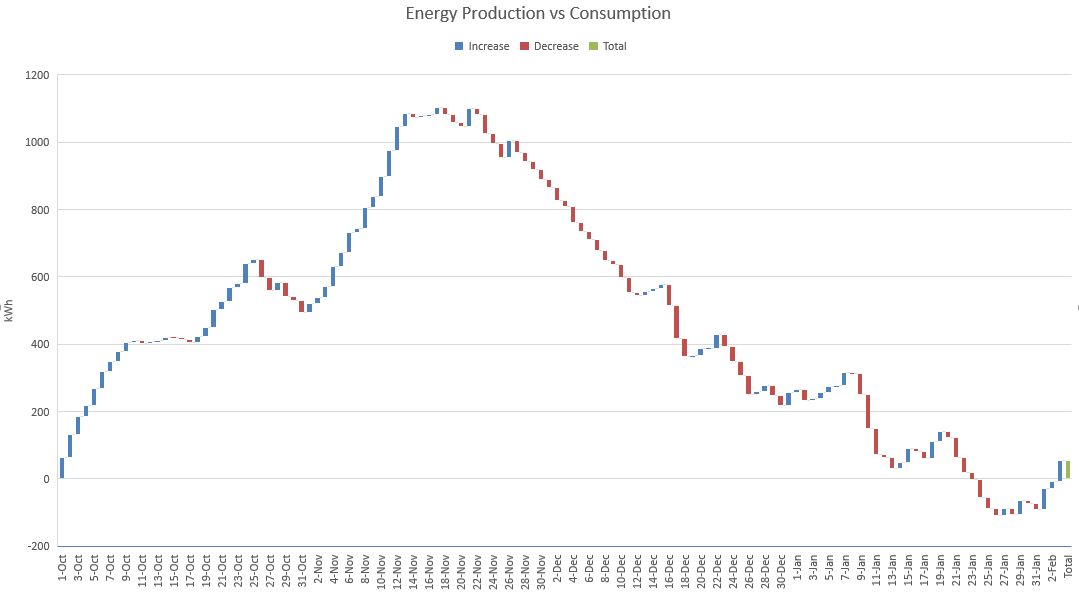
Near the end of January we started using more energy than we had produced since October 1st (when we started tracking). Thanks to a bright sunny start to February, we are back in the green!
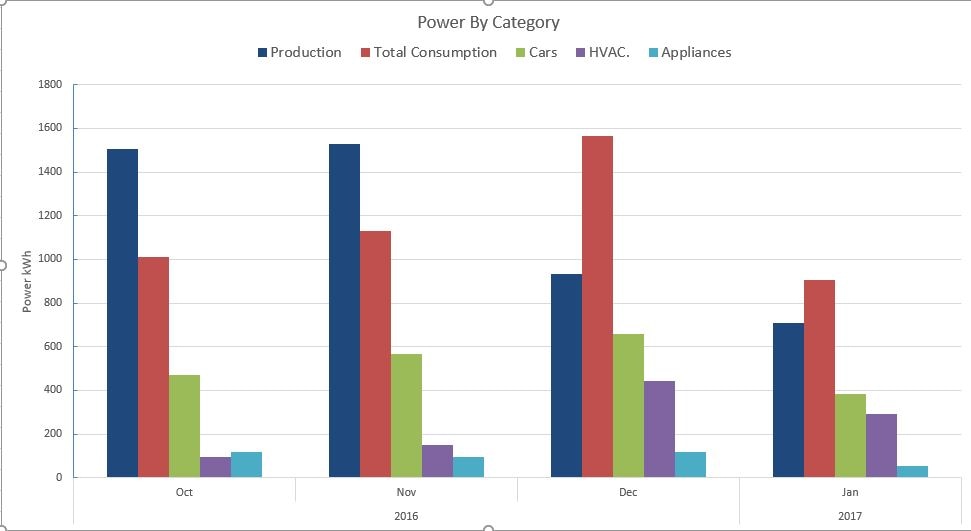
After months of producing more energy than we used, last month's bill arrived and we had to pay the electric company this month...
|
AuthorMark really doesn't like to talk about himself, the house is much more interesting. Archives
September 2020
Categories
All
|
