 We now have a year of data collection in the books! The summary of the final results are as follows:
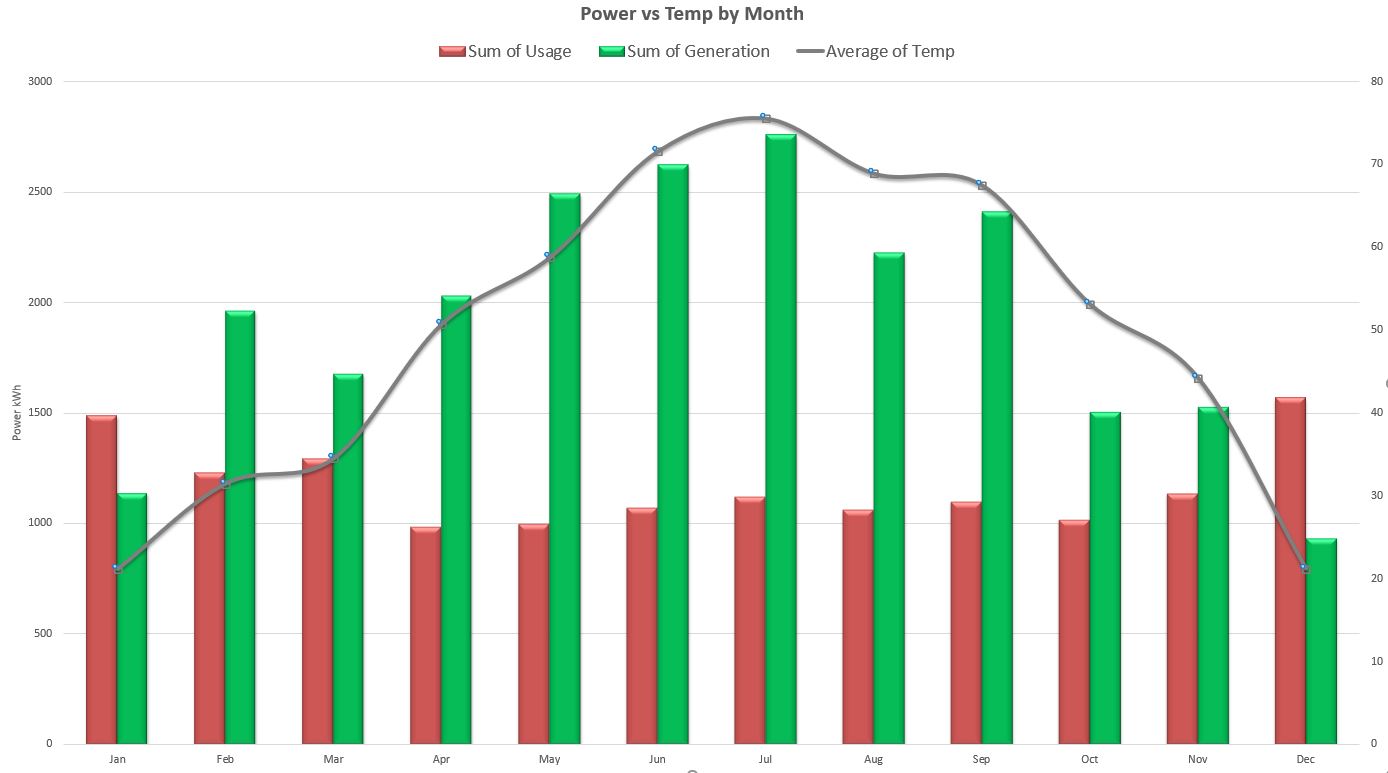
Below is a graph showing the Modelled vs Actual energy use and production. As well as a graph showing the difference between the monthly average temperature between 1980 and 2010 compared with last year's average temperatures. You can see the modelled (striped bars) energy use was much more than the actual energy use throughout the year. It was a little closer in the winter than during the summer months. I'll dig into that, but off-hand I believe part of that is that we used power to preheat the cars in the winter. I had not taken that into account in my original estimates. The modelled production (green striped bar) was less than the overall actual energy produced (solid green bar). During the first couple of quarters we were having trouble with our solar array. Once that got resolved in late March, our actual production was higher than the modelled production. Two big factors went into us using less energy than expected. First, we had a warmer winter than normal. Especially the months of November and February. Second, and the bigger factor, we drove our cars much less than expected. Before we moved, we drove a total of about 36,000 miles/year. We calculated we would drive about 8,000 fewer, or 28,000 miles/year. We actually drove only 13,266 miles! It turns out our car efficiency was less than I expected, especially over the winter. This was due to the energy used to preheat the car (it is so nice to be able to be able to warm the car up in a closed garage without worrying about a tailpipe). In addition, most of our trips were short trips which are less efficient than longer ones in the cold. So while we drove under half of the miles we had planned for, our actual energy for the cars (5800kWh) was a bit above half the energy we had estimated (10,000kWh). Still a great savings:) Many of these variables will change from year to year. For example, we could have a colder than normal winter (less and less likely). We may drive more next year. We could have more cloud cover. However, I am confident we can meet our Net Zero goal in years to come. Saturday October 7th (2017) the Minnesota Renewable Energy Society (MRES) will have a sustainable home tour. Our home, along with many others from Lacrosse to Alexandria, up towards Bemidji over to Duluth will be on tour. There are about five in the Metro area and Insight Brewery is offering a buy a pint, get a pint free to people on the tour. Details can be found by clicking here.
As always, if you have any questions or want to see any graphs of more detailed data (I have LOTS of them) just add a comment here, or on the Ohm Sweet Ohm facebook page and I will be happy to oblige. |