|
We have three months of energy data on the books now! I must say it is much, much easier to be efficient with energy when you can measure it. Just as it is a lot easier to lose weight, or control your blood sugar (if you are diabetic) if you measure your weight or blood sugar. The tool we use for most of our measurements is called EGauge. We have it set up to measure many aspects of our house's electricity use, and I have learned a lot over the last three months watching how different components in the house use power. 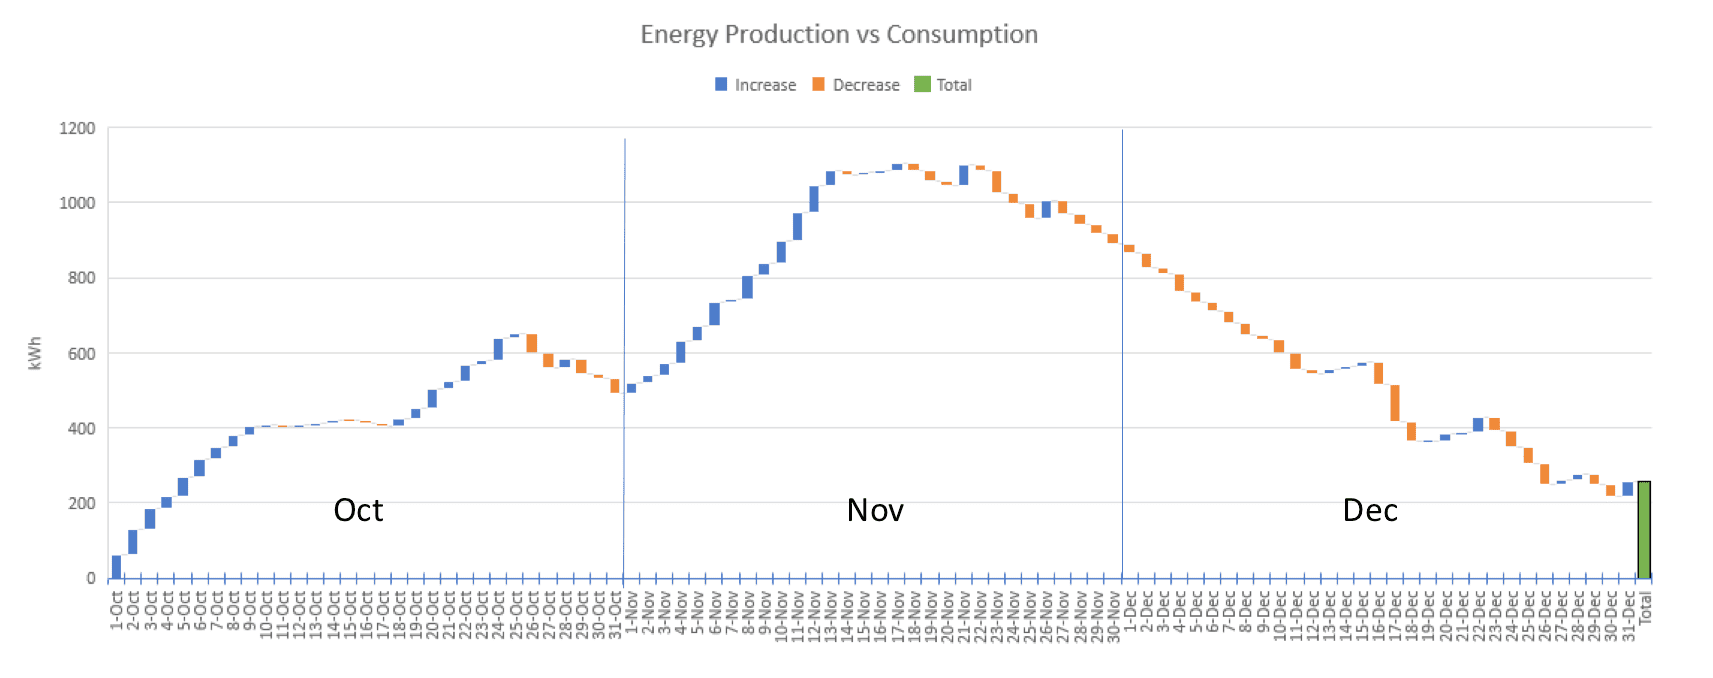 Above is a chart showing our net energy production between October 1st and December 31st. It gives a nice overview of how we are doing on our goal of reaching Net Zero over the year. We ended the year with a surplus, which I expect to last to the later part of January depending upon the sun. Our goal, is to be net zero from Oct 1st 2016, to Oct 1st 2017. I am hoping by March, but certainly April we will be generating more energy than we use once again. We also produced power in September and August. Since our EGauge system was not running until September 30th, I have started the charts on October 1st. This chart shows, the major power using categories and their use in October, November and December. Our vehicles use a lot of power! You can see the HVAC power use is a much larger percetage of our total power in December than in October. On the right is a pie chart of the individual HVAC components . In our house the HVAC system is comprised of an Air Handler (used for both cooling and heating by forced air, and in concentrating the heat from the Heat Pump), our Geothermal Heat Pumps and our Energy Recovery Ventilation system (ERV). Likewise, the Air Handler becomes a much larger percentage of the total HVAC power use as the weather gets colder. The "Strip Heat" is our backup heat. If the infloor heat isn't up to the task the forced air kicks in. If the forced air also can't supply the needed heat, the the strip heater kicks in. So far this winter, we haven't needed the strip heater at all (and we don't expect we ever will). 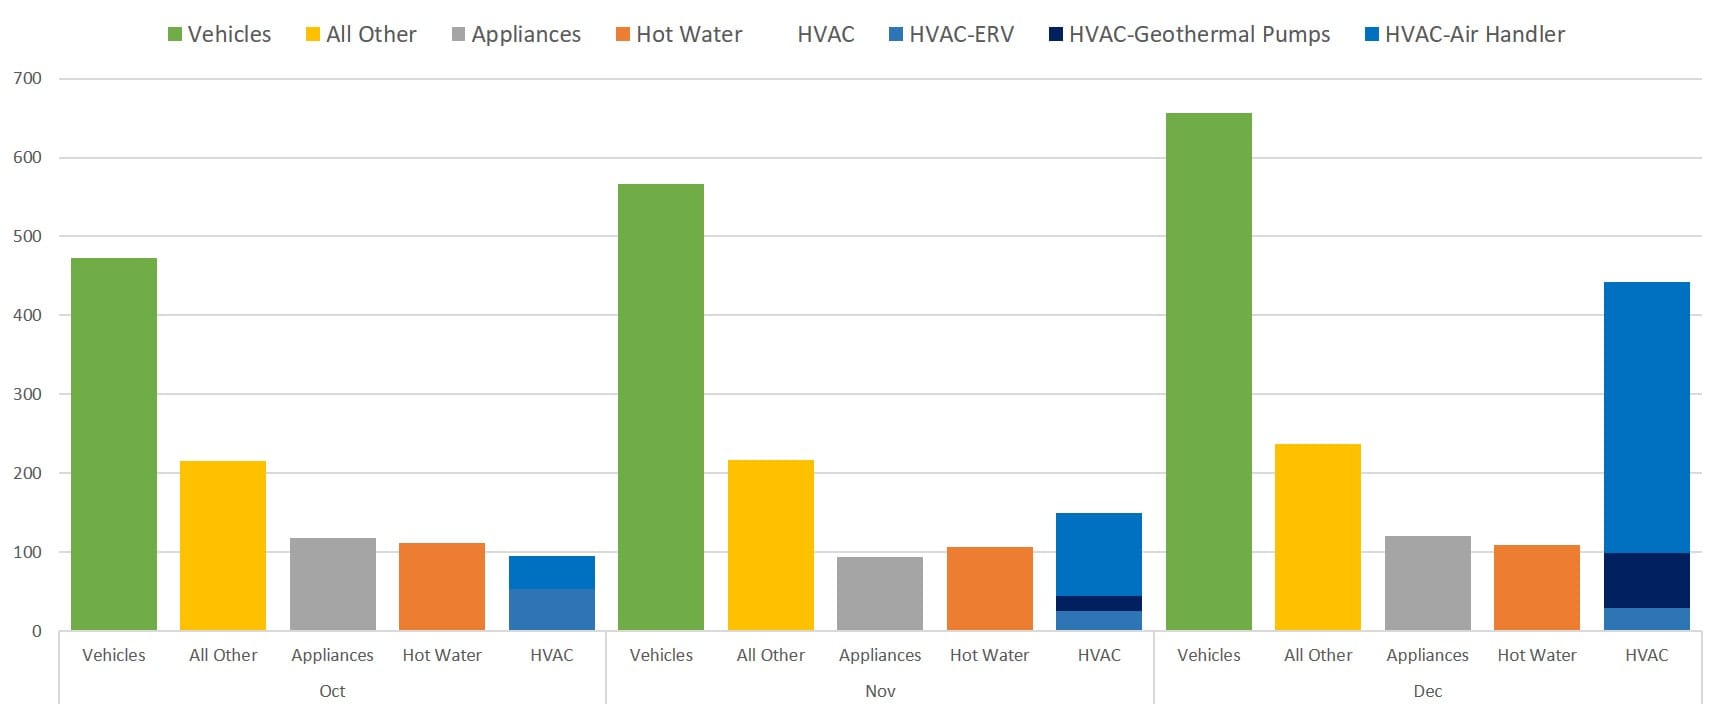 Here is a chart showing the amount of energy, rather than the percentages. The blue column is the heating and ventilation system (HVAC). I apologize for the similarity of the ERV and Air Handler colors. For October, the Geothermal pumps were off, so the two blend together. The Air Handler is about a third of that column, the ERV about two-thirds. I was happily surprised that as the the year progresses many of the categories of energy use has remained stable, or gone up only a little bit. The Air Handler is the biggest increase, although our vehicles are a close second. Most of our heating is still being handled by the heat pumps and infloor radiant heating. However, that system is much more efficient than the Air Handler. Regarding our vehicles, although it takes more energy to move them along the roads in the winter, we also preheat the cars which also shows up under "Vehicles" on this chart. If we didn't preheat the cars, I estimate the gain in colder months would be about half. 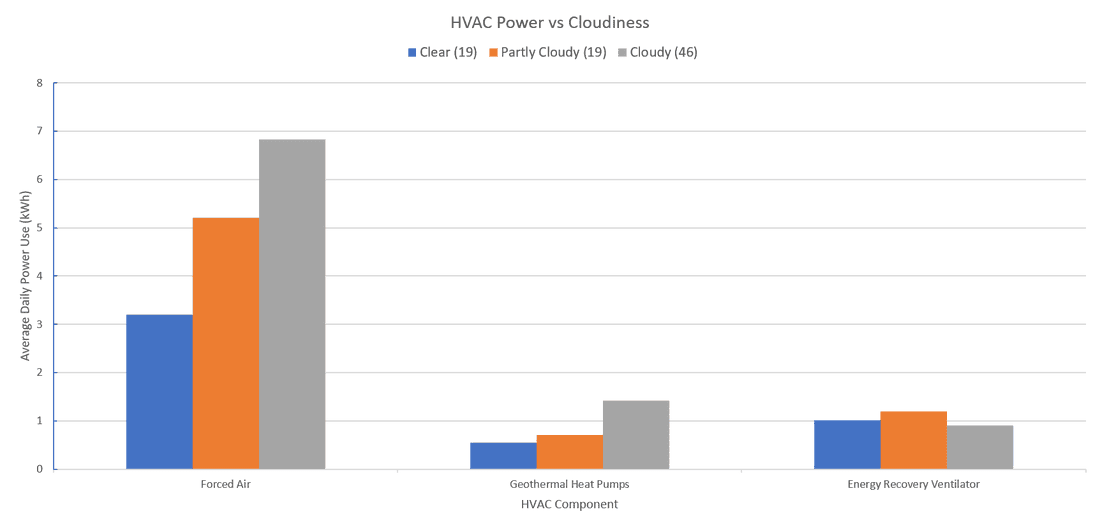 This I found really interesting. Here I charted our HVAC use vs how sunny it was. For cloudiness, I used the data from the National Weather Service. Using the location for "Minneapolis" (which is the Minneapolis International Airport) I took down their rating for the "sky" each day. They rate the sky from 0-10. 0-3 being "Clear", 4-6 "Partly Cloudy" and 7-10 "Cloudy". For purposes of this chart, I am also limiting data points to when the average temperature was less than 60 degrees. So in the chart, I plotted the average power use by each HVAC component against the cloudiness of the sky as measured by the NWS. So far, it looks like our Air Handler and Heat Pumps used a bit more than double the energy on cloudy days than it did on clear days. The Energy Recovery Ventilation system was unaffected. Frankly, I would have been very surprised if it was! This is a great results, showing how our passive solar design is working very well. Even on the few really cold days (temps under 0 degrees fahrenheit), as long as it was sunny out, the HVAC system only used about half the power it would have on a cloudy day. Below is another way to look at the effect of both temperature and sunlight on our HVAC use. 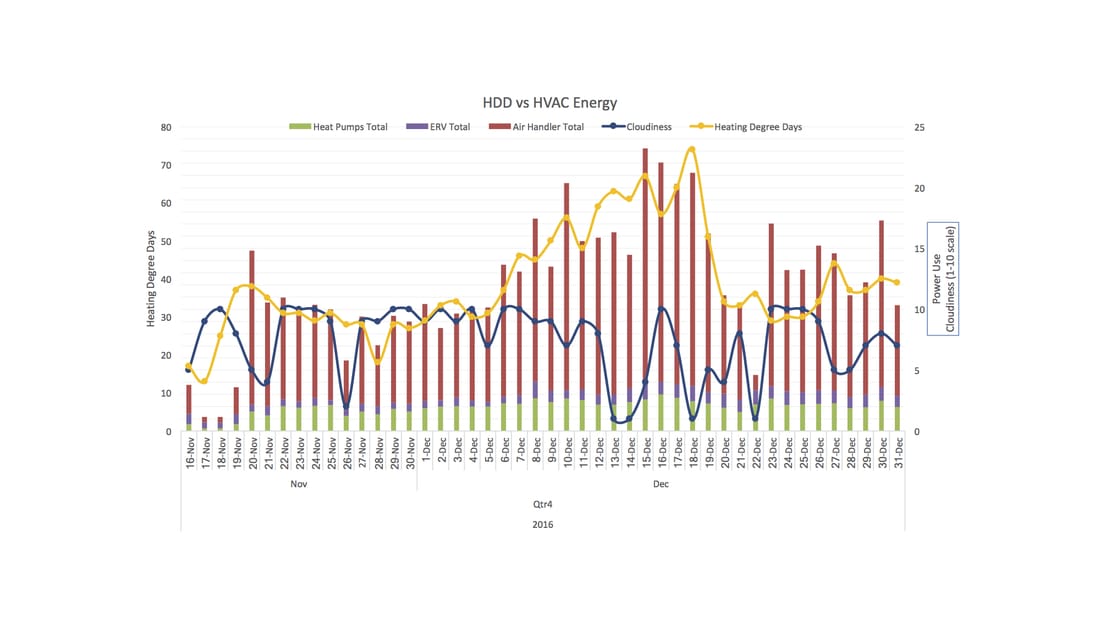 This chart gets a little busy, my apologies. The columns show each component of the HVAC system in terms of their power use, which is on the right axis. The dark blue line shows the cloudiness as reported by the NWS at the Minneapolis airport. The gold line shows the number of Heating Degree Days (HDD) for each day. Heating Degree Days are a way to measure how cold it is over a span of time. To get the number of HDD in a day, take the average temperature that day and subtract it from 65 degrees. You could use a different set point that reflects your personal comfort. The NWS uses 65 degrees, so I will here as well.
If you have any type of data you want to see, or questions about the above charts, please let me know. I have been having a lot of fun finding different ways to view the data we have been collecting.
We are still waiting for some paperwork to be completed before we can get our final certifications. As soon as I have those I will be posting another blog. And on the solar side of things, with a few sunny days happening, we have discovered we still have an issue with our system. The guys at Innovative Power Systems have tried just about everything. They are working with our utility (Xcel) and the manufacturer of the Inverters (SolarEdge) as there seems to be an issue between the safety alerts in the Inverter and the amount of Voltage the Inverters are allowed to put out on the grid. We are using less power than was modeled for us, so far, so I don't see this putting the Net Zero goal at risk, but we really can't wait to get this all settled and working correctly. We also are planning on a Tesla PowerWall in March or April. This will be the second generation of their battery packs, and doesn't require being installed next to an inverter (it has its own built in) so the installation should be much easier. Until next time! Comments are closed.
|